
Have you ever wondered how your phone tells you the average time you’ve spent on apps daily or how your subscription plan impacts your app usage? It’s not magic; it’s data analysis at work! Let’s say you’re running a mobile app company and want to analyze how users engage with your app based on their subscription type (free, basic, or premium), you may use Python’s GroupBy() function to achieve some of these tasks.
In this article, we’ll explore how to use the groupby() function in Python to analyze such data efficiently. But first, let’s understand what GroupBy means.
What is GroupBy?
GroupBy in Python refers to the process of splitting data into groups based on a particular column, applying a function or calculation to each group, and then combining the results. It’s like sorting your data by categories (such as subscription type), performing operations (like averaging), and then summarizing those results.
Syntax:
dataframe.groupby('column_name')['target_column'].operation()dataframe.groupby('column_name'): Groups the DataFrame based on unique values in the specified column.['target_column']: Specifies the column to which the operation will be applied..operation(): Performs an aggregate or transformation operation, like mean(), sum(), or count().
Python’s Pandas library offers an easy and optimized way to perform GroupBy operations. It helps organize large datasets and makes it simple to extract useful information, like calculating the average daily usage time based on subscription types.
Analyzing Mobile App Usage-A Real-world Analogy

Let’s look at a scenario to understand how GroupBy works. Imagine your app development company wants to analyze how users from different subscription tiers (Free, Basic, and Premium) use the app. You want to calculate the average daily usage time for each subscription type to understand user engagement better.
Here’s a dataset that reflects user activity:
| User ID | Subscription Type | Daily Usage (minutes) |
| 1 | Free | 30 |
| 2 | Basic | 45 |
| 3 | Premium | 120 |
| 4 | Free | 25 |
| 5 | Premium | 150 |
| 6 | Basic | 50 |
In this dataset:
- Subscription Type represents whether a user is on a Free, Basic, or Premium plan.
- Daily Usage (minutes) tracks how much time each user spends on the app daily.
Steps to Use GroupBy in Python in this Scenario:
You need to calculate the average time spent on the app by each subscription type. This will allow you to understand the differences in app usage between the Free, Basic, and Premium users.
- Import Necessary Libraries
Begin by importing thepandaslibrary, which provides the GroupBy functionality.
import pandas as pd
- Create a Sample Dataset
Define the dataset as a dictionary and convert it into a pandasDataFrame.
data = {

    'User ID': [1, 2, 3, 4, 5, 6],

    'Subscription Type': ['Free', 'Basic', 'Premium', 'Free', 'Premium', 'Basic'],

    'Daily Usage (minutes)': [30, 45, 120, 25, 150, 50]

}

df = pd.DataFrame(data)- Group Data Using GroupBy
Use thegroupby()method to group data by the column “Subscription Type” and create separate groups for each type.
grouped = df.groupby('Subscription Type')- Apply Aggregation Functions
Calculate the average daily usage for each subscription type by applying themean()function.
average_usage = grouped['Daily Usage (minutes)'].mean()
- Display the Results
Print the calculated averages for each subscription type.
print("Average Daily Usage (minutes) by Subscription Type:")

print(average_usage)
Output:
Average Daily Usage (minutes) by Subscription Type:

Subscription Type

Basic       47.5

Free        27.5

Premium    135.0

Name: Daily Usage (minutes), dtype: float64
What Did We Learn From The Output?
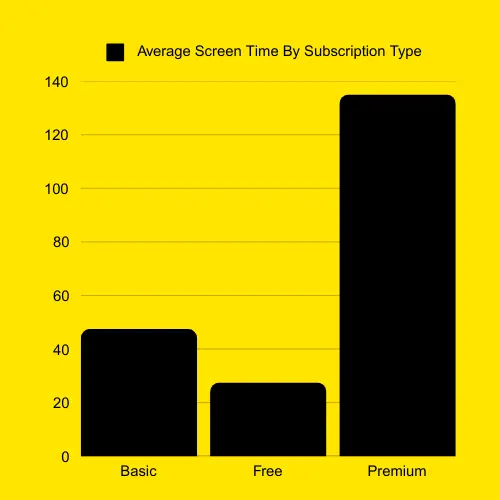
- Basic users spend about 47.5 minutes daily on the app.
- Free users spend around 27.5 minutes daily.
- Premium users spend the most, with an average of 135 minutes daily.
This information helps the app company improve user engagement and create features for each subscription type.
Advanced Grouping Scenarios
Now we’ve learned how GroupBy helps in analyzing basic user data, like calculating the average daily usage for different subscription types (Free, Basic, and Premium). But what if you want a deeper understanding? Imagine you want to not only know the average daily usage but also the total usage for each subscription type, or perhaps understand how usage varies between users. Here’s how you can perform a more complex analysis using groupby():
- Using Multiple Aggregation Functions
You can apply more than one aggregation function to the same grouped data because sometimes, knowing just the average usage isn’t enough.
Example:
You might want to know the total usage as well. Let’s say your app company is planning to upgrade its features. You need to know not only how much time users spend on average but also the total usage. For example, the Free plan might have many users, but when you add up all their usage, it could be lower than the Premium plan, which has fewer users but uses the app more. This gives you a better picture of where most of the app activity is happening. So, let’s calculate both the average and total usage for each subscription type.
Code:
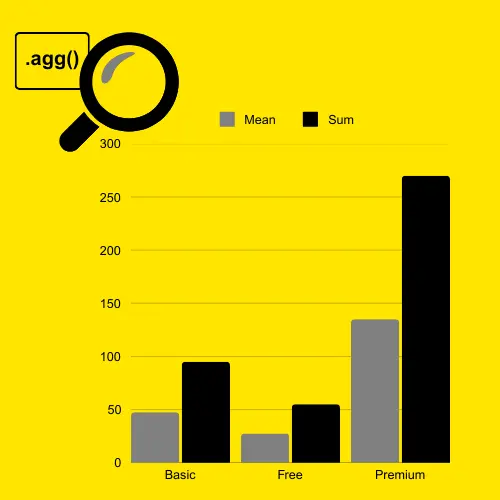
The code below groups the data by “Subscription Type” and calculates both the average (mean) and total (sum) daily usage for each subscription type using the .agg() function.
usage_stats = df.groupby('Subscription Type')['Daily Usage (minutes)'].agg(['mean', 'sum'])

print(usage_stats)
Output:
					mean  sum

Subscription Type

Basic               47.5   95

Free                27.5   55

Premium            135.0  270
2. Using Custom Functions
GroupBy also supports custom aggregation functions.
Example:
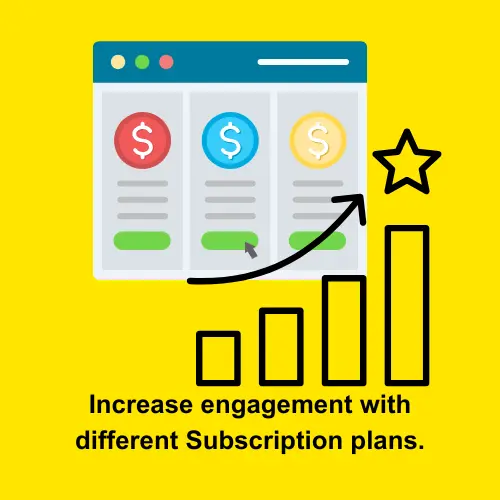
Your app company wants to improve user engagement with different subscription plans. Premium users are expected to use the app more, but there could be a lot of variation in how often they use it. Some may use it daily, while others hardly use it. Free users, however, may have more consistent but lower usage. By calculating the range (difference between maximum and minimum daily usage), you can better understand the variation in app usage for each subscription type. This can help create targeted features or rewards based on user activity.
Code:
The code groups the data by “Subscription Type” and calculates the difference between the maximum and minimum daily usage for each subscription type using a custom function with lambda. The lambda x: x.max() - x.min() calculates the range of usage by subtracting the smallest value from the largest for each group. Finally, it prints the usage range (difference between max and min) for each subscription type.
usage_range = df.groupby('Subscription Type')['Daily Usage (minutes)'].agg(lambda x: x.max() - x.min())

print(usage_range)Output:
Subscription Type

Basic      25

Free        5

Premium    30

Name: Daily Usage (minutes), dtype: int64
3. Resetting Index
After performing GroupBy operations, the result often has a MultiIndex (especially if you group by multiple columns). Use .reset_index() to convert it back to a flat DataFrame for easier manipulation. Flat DataFrames are tables where the data is organized with a single level of column and row labels, making it easier to read and work with.
Example:
Let’s say the company is preparing a report for the marketing team. The team needs to easily view and compare the average daily usage for each subscription type, but the current data is in a MultiIndex format, making it harder to read and understand. To simplify the data, you can reset the index, turning the MultiIndex into a flat DataFrame. This makes it easier for the team to quickly look at the numbers without getting confused by extra layers of data.
Code:
The code groups the data by “Subscription Type” and calculates the average (mean) of all numerical columns for each subscription type using the mean aggregation function. .reset_index() resets the index of the resulting dataframe, making “Subscription Type” a regular column instead of the index. Finally, it prints the result.
result = df.groupby('Subscription Type').agg('mean').reset_index()

print(result)Output:
Subscription   Type  Daily Usage (minutes)

0              Basic                   47.5

1               Free                   27.5

2            Premium                  135.0
4. GroupBy with Sorting
GroupBy allows you to sort the results by specific metrics.
Example:
Suppose the company wants to prioritize improving the most popular subscription plans. By sorting the total usage, you can quickly see which subscription types are being used the most and allocate resources effectively by focusing on the plans with the highest engagement first.
Code:
The code first groups the data and calculates the total daily usage (sum) for each subscription type using .sum(). It then sorts the total usage values in descending order with .sort_values(ascending=False), so that the subscription types with the highest usage appear first. Finally, it prints the sorted results ordered from highest to lowest.
total_usage = df.groupby('Subscription Type')['Daily Usage (minutes)'].sum()

sorted_usage = total_usage.sort_values(ascending=False)

print(sorted_usage)Output:
Subscription Type

Premium    270

Basic       95

Free        55

Name: Daily Usage (minutes), dtype: int64
5. Handling Missing Data
Missing values can affect your analysis, but you can handle them before applying GroupBy. You can either fill them with fillna() or drop them off with dropna() to ensure your groups are calculated correctly.
Example:
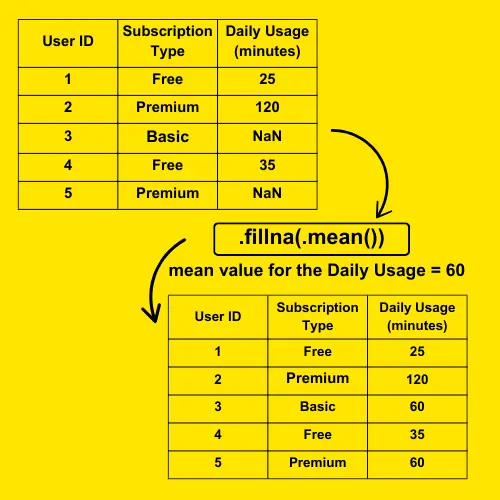
Imagine that during data collection, some users didn’t log their daily usage, leading to missing values in your dataset. If you don’t handle these missing values before performing your GroupBy operation, it could affect your results and give an inaccurate picture of user behavior. To ensure reliable analysis, you have to handle missing data before using groupby().
Code:
The code replaces any missing values (NaN) in the Daily Usage (minutes) column with the average (mean) value of that column. df['Daily Usage (minutes)'].mean() calculates the mean of the column, and .fillna() fills the missing values with this calculated mean. This ensures that there are no missing values in the column, and the data remains complete.
# Fill missing values with the mean
df['Daily Usage (minutes)'] = df['Daily Usage (minutes)'].fillna(df['Daily Usage (minutes)'].mean())
GroupBy + Apply: Advanced Customization
Now that we’ve explored basic GroupBy operations, let’s take it a step further by using the apply() function. With groupby + apply, you can apply custom functions to each group, allowing for greater flexibility and control.
Example: Normalizing Daily Usage
Let’s say you want to normalize the daily usage data for each subscription type. Normalization helps scale the data so that it falls within a specific range (e.g., 0 to 1). This is useful when comparing groups with different scales of usage.
Code:
- The
normalize()function computes the normalized value for the “Daily Usage (minutes)” column within each group. - The
apply()function applies this custom function to each group created bygroupby(). - The resulting DataFrame includes a new column “Normalized Usage” with values ranging from 0 to 1 within each subscription type.
def normalize(group):
    group['Normalized Usage'] = (group['Daily Usage (minutes)'] - group['Daily Usage (minutes)'].min()) / \
                                (group['Daily Usage (minutes)'].max() - group['Daily Usage (minutes)'].min())
    return group

normalized_df = df.groupby('Subscription Type').apply(normalize)

print(normalized_df)
Output:
User ID Subscription Type  Daily Usage (minutes)  Normalized Usage
0        1             Free                    30          1.0
1        2            Basic                    45          0.0
2        3          Premium                   120          0.0
3        4             Free                    25          0.0
4        5          Premium                   150          1.0
5        6            Basic                    50          1.0
How Real-World Big Companies Use GroupBy for Analysis?
Big companies and apps use the GroupBy function frequently to manage large datasets. For example:
- Subscription-Based Models: Companies like Netflix and Spotify analyze user engagement by grouping data based on subscription types. This helps them understand which plans are most popular and how to improve the user experience.
- Sales Analysis: E-commerce platforms such as Amazon use GroupBy to analyze sales by product category, region, or time of year, helping them adjust marketing strategies.
- Customer Behavior: Social media platforms like Facebook and Instagram group user data based on activity, location, or age to personalize content and ads.
In all these cases, GroupBy helps companies extract valuable information that shapes business decisions and improves customer experiences.
Conclusion
Python’s GroupBy is a powerful tool for analyzing data in categories. For example, in our mobile app case, it helped show trends in user engagement based on subscription type. By now, you know how to use GroupBy effectively to group data and perform meaningful operations.
So, the next time you wonder how apps track your screen time, remember—it’s all about grouping and analyzing the right data to make smart choices!
For more engaging and informative articles on Python, check out our Python tutorial series at Syntax Scenarios.
Related How-to Articles in Python
.