What is Data Normalization?
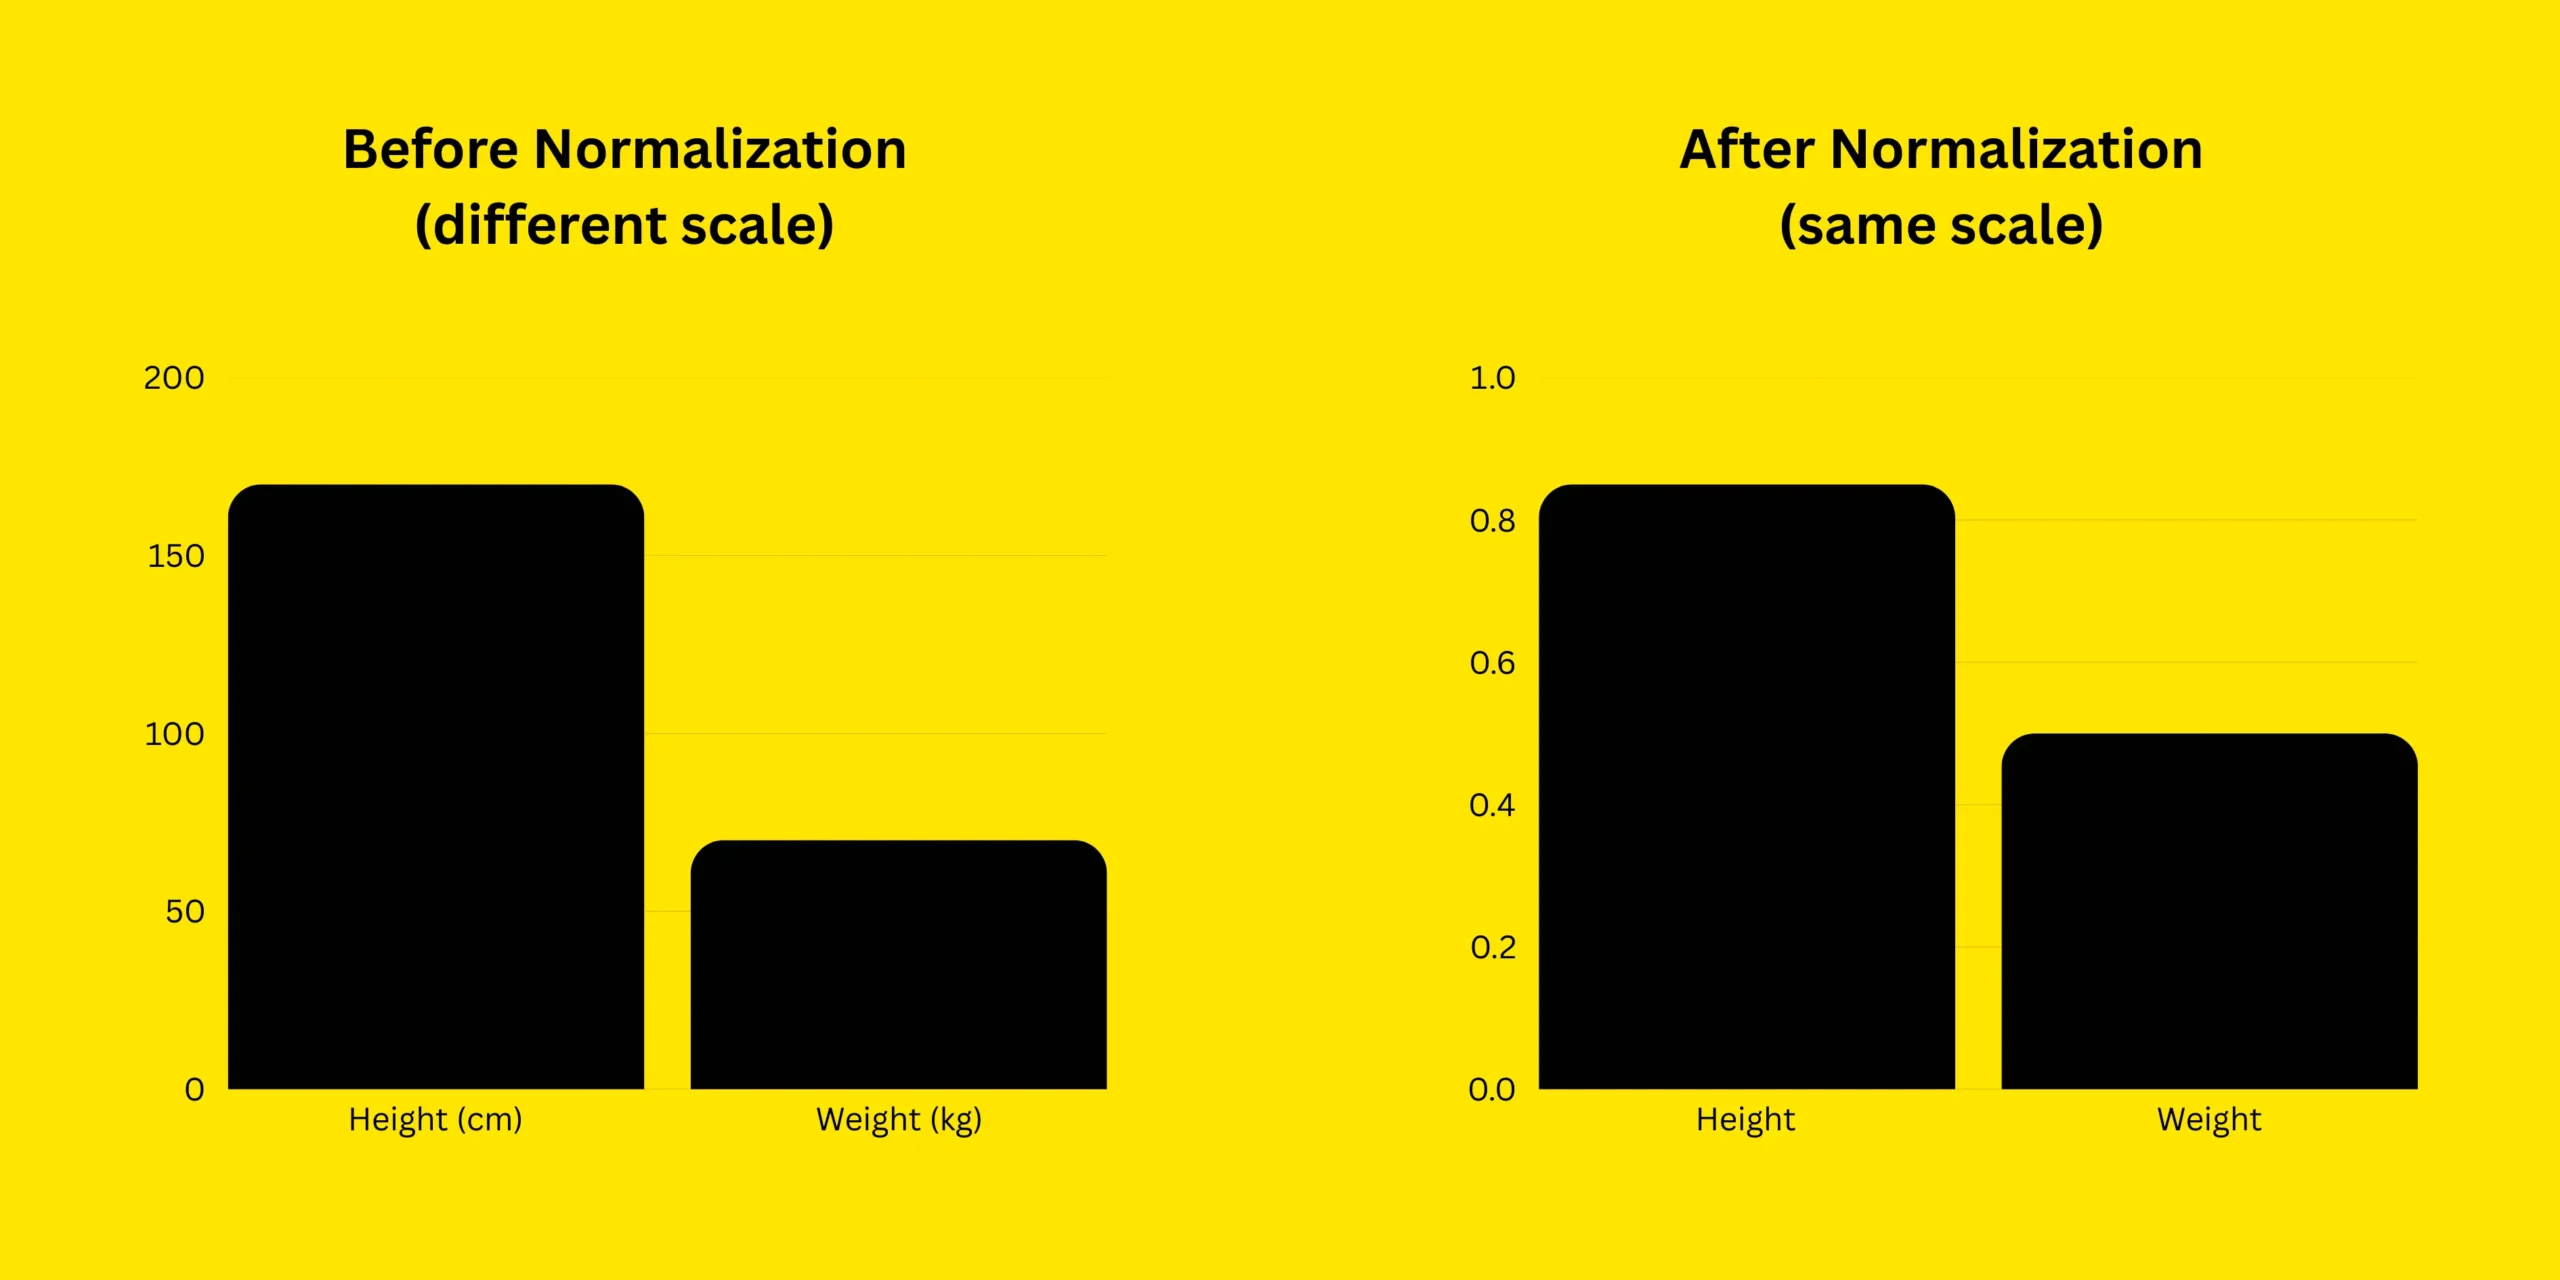
Data normalization means changing the numbers in a dataset so they are not too big or too small compared to each other. Sometimes, some numbers are very big and some are very small. This can confuse a machine learning model. For example, think about comparing people’s height and weight. Height might be in centimeters, like 170 cm, and weight might be in kilograms, like 70 kg. These numbers are very different in size, even though both are important. A machine learning model might think height is more important just because the number is bigger. Normalization fixes this by putting height and weight on the same scale, like between 0 and 1. This way, the model treats both features fairly and makes better predictions.
Why Normalize Data?
- Helps the model work better: Some machine learning models do a better job when all the numbers are on the same scale. It makes it easier for the model to understand the data.
- Speeds up training: When numbers are not too big or too small, the model can learn quicker. It doesn’t waste time trying to understand big or small numbers.
- Improves accuracy: If one number is much bigger than another, the model might think it’s more important, even if it’s not. Normalization fixes this by making all numbers balanced, so the model doesn’t get confused.
Methods of Normalization in scikit-learn
There are multiple methods for normalizing data in scikit-learn. Each method has its own use case, depending on the nature of the data and the presence of outliers (very big or very small values). Below are some common normalization techniques:
1. Min-Max Scaling (Normalization)
Min-Max Scaling is a way to change the numbers in a dataset so that they all fall between a range, usually from 0 to 1. It works by taking the smallest number and making it 0, and the biggest number becomes 1. All the other numbers are adjusted to fit between these two. This helps the model work better because all the numbers are now on the same scale. It follows this formula:
Xnormalized = (X - Xmin) / (Xmax -Xmin)
How It Works:
- Finds the minimum and maximum values in the dataset.
- Subtracts the minimum value from each data point.
- Divides by the range (maximum – minimum) to scale between 0 and 1.
Example: Normalizing Height and Weight
Suppose we have a dataset of people’s heights (in cm) and weights (in kg):
| Person | Height (in cm) | Weight (in Kg) |
|---|---|---|
| A | 150 | 50 |
| B | 160 | 55 |
| C | 170 | 65 |
| D | 180 | 75 |
| E | 190 | 80 |
Explanation:
First, we create a dataset with height and weight values. Since these numbers are on different scales, we use MinMaxScaler() to adjust them. MinMaxScaler() transforms the data by scaling each value between 0 and 1, based on the minimum and maximum values in the dataset. The fit_transform() method applies this scaling, ensuring that height and weight are on the same scale and have equal importance. This makes it easier for a machine learning model to understand the data.
from sklearn.preprocessing import MinMaxScaler
import numpy as np

# Sample data (Height in cm, Weight in kg)
data = np.array([[150, 50], [160, 55], [170, 65], [180, 75], [190, 80]])

# Initialize MinMaxScaler
scaler = MinMaxScaler()
normalized_data = scaler.fit_transform(data)

print(normalized_data)
Output:
[[0.   0.  ]
 [0.25 0.2 ]
 [0.5  0.5 ]
 [0.75 0.75]
 [1.   1.  ]]
2. Z-Score Standardization (StandardScaler)
Z-Score Standardization is a way to adjust the data so that it has a mean of 0 and a standard deviation of 1. To do this, you take each number, subtract the average of all the numbers, and then divide by how spread out the numbers are (the standard deviation). This method ensures that most of the numbers are close to 0 and that the spread of the data is balanced. It works well when the data has different values, like height and weight, or when there are outliers(very big or small numbers), as it helps reduce their effect. The formula is:
Xstandardized = (X - μ) / σ
Where:
- μ is the mean (average) of the data.
- σ is the standard deviation.
Example: Standardizing Height and Weight
Again, we have height and weight data. Since height and weight are in different units, a machine learning model might consider weight more important. Z-score standardization ensures that both features are treated equally.
Explanation:
First, we create a dataset with height and weight values. Since these numbers have different scales, we use StandardScaler() to standardize them. StandardScaler() adjusts the data by subtracting the mean and dividing by the standard deviation, ensuring the values have a mean of 0 and a consistent spread. The fit_transform() method applies this transformation so the values follow a normal pattern. This makes it easier for a machine learning model to understand the data.
from sklearn.preprocessing import StandardScaler
import numpy as np

# Sample data (Height in cm, Weight in kg)
data = np.array([[150, 50], [160, 55], [170, 65], [180, 75], [190, 80]])

# Initialize StandardScaler
scaler = StandardScaler()
standardized_data = scaler.fit_transform(data)

print(standardized_data)
Output:
[[-1.41 -1.41]
 [-0.71 -0.71]
 [ 0.    0.  ]
 [ 0.71  0.71]
 [ 1.41  1.41]]
3. Max Abs Scaling
MaxAbs Scaling is a method used to scale the data so that all values are between -1 and 1. It works by dividing each value in the dataset by the maximum absolute value (the biggest number in terms of size, regardless of whether it’s positive or negative). This way, the largest value becomes 1, and the smallest value becomes -1, while all other values are scaled accordingly. MaxAbs Scaling is useful when the data is already centered around 0 and does not have outliers, making it a good option for data that is already in a specific range.
Example: Scaling Height and Weight
Suppose we have height and weight values, but we also include weight loss or gain (which can be negative).
Explanation:
The dataset has height and weight changes, including some negative numbers. To adjust the scale, we use MaxAbsScaler(), which divides each number by the largest value in the dataset. This keeps all values between -1 and 1 while keeping negative numbers unchanged. The fit_transform() method applies this scaling to the whole dataset, making sure everything follows the same rule. This is useful when data has both positive and negative numbers, helping machine learning models understand the data better without changing its meaning.
from sklearn.preprocessing import MaxAbsScaler
import numpy as np

# Sample data (Height in cm, Weight change in kg)
data = np.array([[150, -5], [160, -2], [170, 0], [180, 3], [190, 5]])

# Initialize MaxAbsScaler
scaler = MaxAbsScaler()
maxabs_scaled_data = scaler.fit_transform(data)

print(maxabs_scaled_data)
Output:
[[ 0.789 -1.  ]
 [ 0.842 -0.4 ]
 [ 0.895  0.  ]
 [ 0.947  0.6 ]
 [ 1.     1.  ]]
Which Method Should You Use?
- Min-Max Scaling: Use this when you need the values to be between 0 and 1. It’s helpful when your data has a known range and you want to scale everything to fit between these two values.
- Z-Score Standardization: Use this when you want your data to have a mean of 0 and a standard deviation of 1. This is good for data with different units or spreads, and it works well when the data might have outliers.
- Max Abs Scaling: Use this when your data has both positive and negative values and you want to scale it between -1 and 1. This method works well for data that is already centered around 0, like sparse data used in some machine learning models. When data contains both positive and negative values.
Conclusion
In simple terms, normalization helps machine learning models work better by making sure all the data is on the same scale. Without normalization, the model might think bigger numbers are more important, which could lead to wrong predictions. Min-Max Scaling changes the values so they fall between 0 and 1. Z-Score Standardization gives the data a mean of 0 and a standard deviation of 1. Max Abs Scaling is useful when the data has both positive and negative values. Choosing the right method helps the model become more accurate, faster, and fairer when comparing different features.
/related